
Definition of forecasting criteria in eGAFOR
The partners have agreed that eGAFOR system should translate meteorological forecast into impact (state of the route) shown in “traffic-light” colors in order to be user-friendly. The relation between each forecast MET element and impact will be shown in the following paragraphs.
Some changes have been made to the document based on conclusions of WP4 workshop for lecturers and experts held in Belgrade on October 16th and 17th 2019. The changes consist of:
- Renaming MET element “Low clouds” to “Clouds”
- Exclusion of “EMBD” from “EMBD/FQ/SQL” class
- Introducing a vertical spread of turbulence MET element
Clouds:
Clouds (CLD) shall be forecast as a polygon with a relatively uniform cloud base defined in height above mean sea level (AMSL). Due to the objective impossibility of determining the exact cloud base, an uncertainty of cloud base shall be introduced.
The uncertainty zone is a zone between the minimal and maximal value of forecast cloud base. Both values are entered by the forecaster.
The eGAFOR system should subtract ground elevation and 1500 ft (modifiable) from the upper and lower boundary of the uncertainty zone over the area of LC polygon along the route cross-section and determine the impact on each affected route depending on the relation shown in Table 1:
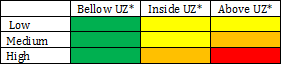
Table 1 Values on the horizontal axis of the table represent ground elevation + CLD threshold (default value is 1500ft, but it is modifiable in a certain range by user), values on the vertical axis are probability classes. Cell colors represent impact.
UZ* = Uncertainty zone (Image 1)
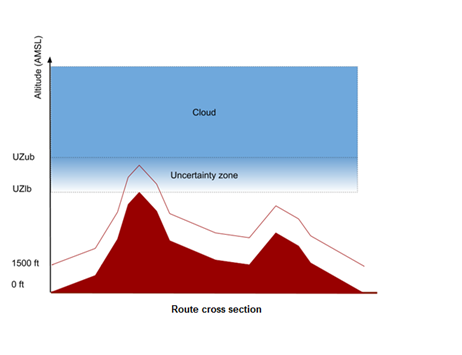
Image 1 Schematic view of the Uncertainty Zone. Vertical axis represents altitude.
UZub – Uncertainty Zone upper boundary
UZlb – Uncertainty Zone lower boundary
GR – Ground elevation
Visibility
Visibility shall be forecast in three classes:
- Below 1.5 km
- Between 1.5 and 5 km
- Between 5 and 8 km
Visibility above 8 km shall not be forecast. The visibility forecast will be entered as a polygon of a certain visibility class and probability of occurrence.
The eGAFOR system should determine impact depending on the relation shown in Table 2:
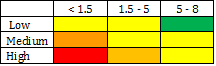
Table 2 Values on the horizontal axis of the table represent visibility classes, values on the vertical axis are probability classes. Cell colors represent impact.
Turbulence
Two severity classes of turbulence shall be forecast:
- MOD = moderate
- SEV = severe
The turbulence forecast will be entered as a polygon of a certain severity class and probability of occurrence.
The eGAFOR system should determine impact depending on relation shown in Table 3:
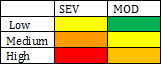
Table 3 Values on the horizontal
axis of the table represent turbulence severity classes, values on the vertical
axis are probability classes. Cell colors represent impact.
Cumulonimbus Clouds
Three classes of the horizontal distribution of Cumulonimbus (CB) clouds shall be forecast:
- ISOL
- OCNL
- EMBD/FRQ/SQL
Isolated (ISOL) if it consists of individual features which affect, or are forecast to affect, an area with a maximum spatial coverage less than 50 per cent of the area concerned (at a fixed time or during the period of validity)
Occasional (OCNL) if it consists of well-separated features which affect, or are forecast to affect, an area with a maximum spatial coverage between 50 and 75 percent of the area concerned (at a fixed time or during the period of validity)
Embedded (EMBD) if it is embedded within cloud layers and cannot be readily recognized
Frequent (FRQ) if within that area there is little or no separation between adjacent thunderstorms with a maximum spatial coverage greater than 75 percent of the area affected, or forecast to be affected, by the phenomenon (at a fixed time or during the period of validity)
Squall line (SQL) should indicate a thunderstorm along a line with little or no space between individual clouds
The cumulonimbus clouds forecast will be entered as a polygon of a certain distribution class and probability of occurrence.
The eGAFOR system should determine impact depending on relation shown in Table 4:
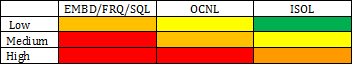
Table 4 Values on the horizontal axis of the table represent Cumulonimbus clouds distribution classes, values on the vertical axis are probability classes. Cell colors represent impact.
Freezing precipitation
An area with any amount of freezing precipitation shall be forecast as a polygon of a certain probability of occurrence.
The eGAFOR system should determine impact depending on relation shown in Table 5:
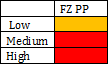
Table 5 Values on the vertical axis are probability classes. Cell colors represent impact.
Final impact on a route
When the separate impact of each MET element will be determined for each route, the eGAFOR system should choose the biggest individual impact as the final impact for the route.